# Install packages
if (!requireNamespace("ggplot2", quietly = TRUE)) {
  install.packages("ggplot2")
}

# Load packages
library(ggplot2)Multiple Histograms
Note
Hiplot website
This page is the tutorial for source code version of the Hiplot Multiple Histograms plugin. You can also use the Hiplot website to achieve no code ploting. For more information please see the following link:
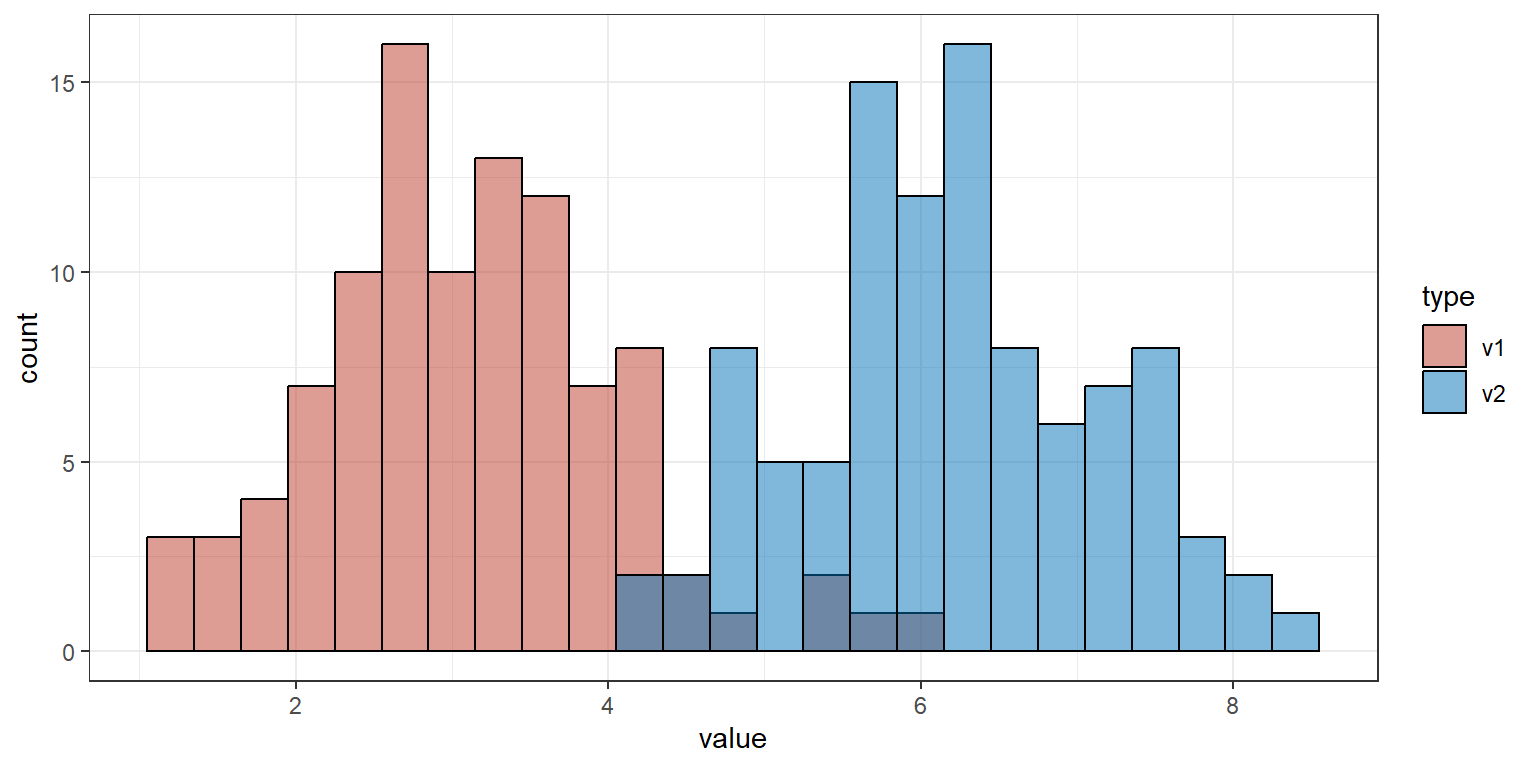
Multiple histograms are plotted on the same graph to compare differences between multiple sets of data.
Setup
System Requirements: Cross-platform (Linux/MacOS/Windows)
Programming language: R
Dependent packages:
ggplot2
Data Preparation
# Load data
data <- read.delim("files/Hiplot/125-multiple-histograms-data.txt", header = T)

# View data
head(data)
type value
1 v1 3.059937
2 v1 1.907186
3 v1 4.278629
4 v1 3.834794
5 v1 5.493830
6 v1 1.380032Visualization
# Multiple Histograms
p <- ggplot(data, aes(x = value, fill = type)) +
  geom_histogram(color = "black", alpha = 0.5,
                 position = "identity", binwidth = 0.3) +
  scale_fill_manual(values = c("#BC3C29FF","#0072B5FF")) +
  theme_bw()

p