# Install packages
if (!requireNamespace("metawho", quietly = TRUE)) {
  install.packages("metawho")
}
if (!requireNamespace("cowplot", quietly = TRUE)) {
  install.packages("cowplot")
}

# Load packages
library(metawho)
library(cowplot)Meta-Subgroup Analysis
Note
Hiplot website
This page is the tutorial for source code version of the Hiplot Meta-Subgroup Analysis plugin. You can also use the Hiplot website to achieve no code ploting. For more information please see the following link:
The goal of metawho is to provide simple R implementation of “Meta-analytical method to Identify Who Benefits Most from Treatments”.
metawho is powered by R package metafor and does not support dataset contains individuals for now. Please use stata package ipdmetan if you are more familar with stata code.
Setup
System Requirements: Cross-platform (Linux/MacOS/Windows)
Programming language: R
Dependent packages:
meta;cowplot
Data Preparation
# Load data
data <- read.delim("files/Hiplot/121-metawho-data.txt", header = T)
# Convert data structure
data = deft_prepare(data, conf_level = 1 - 0.95)
res = deft_do(data, group_level = unique(data$subgroup))
# View data
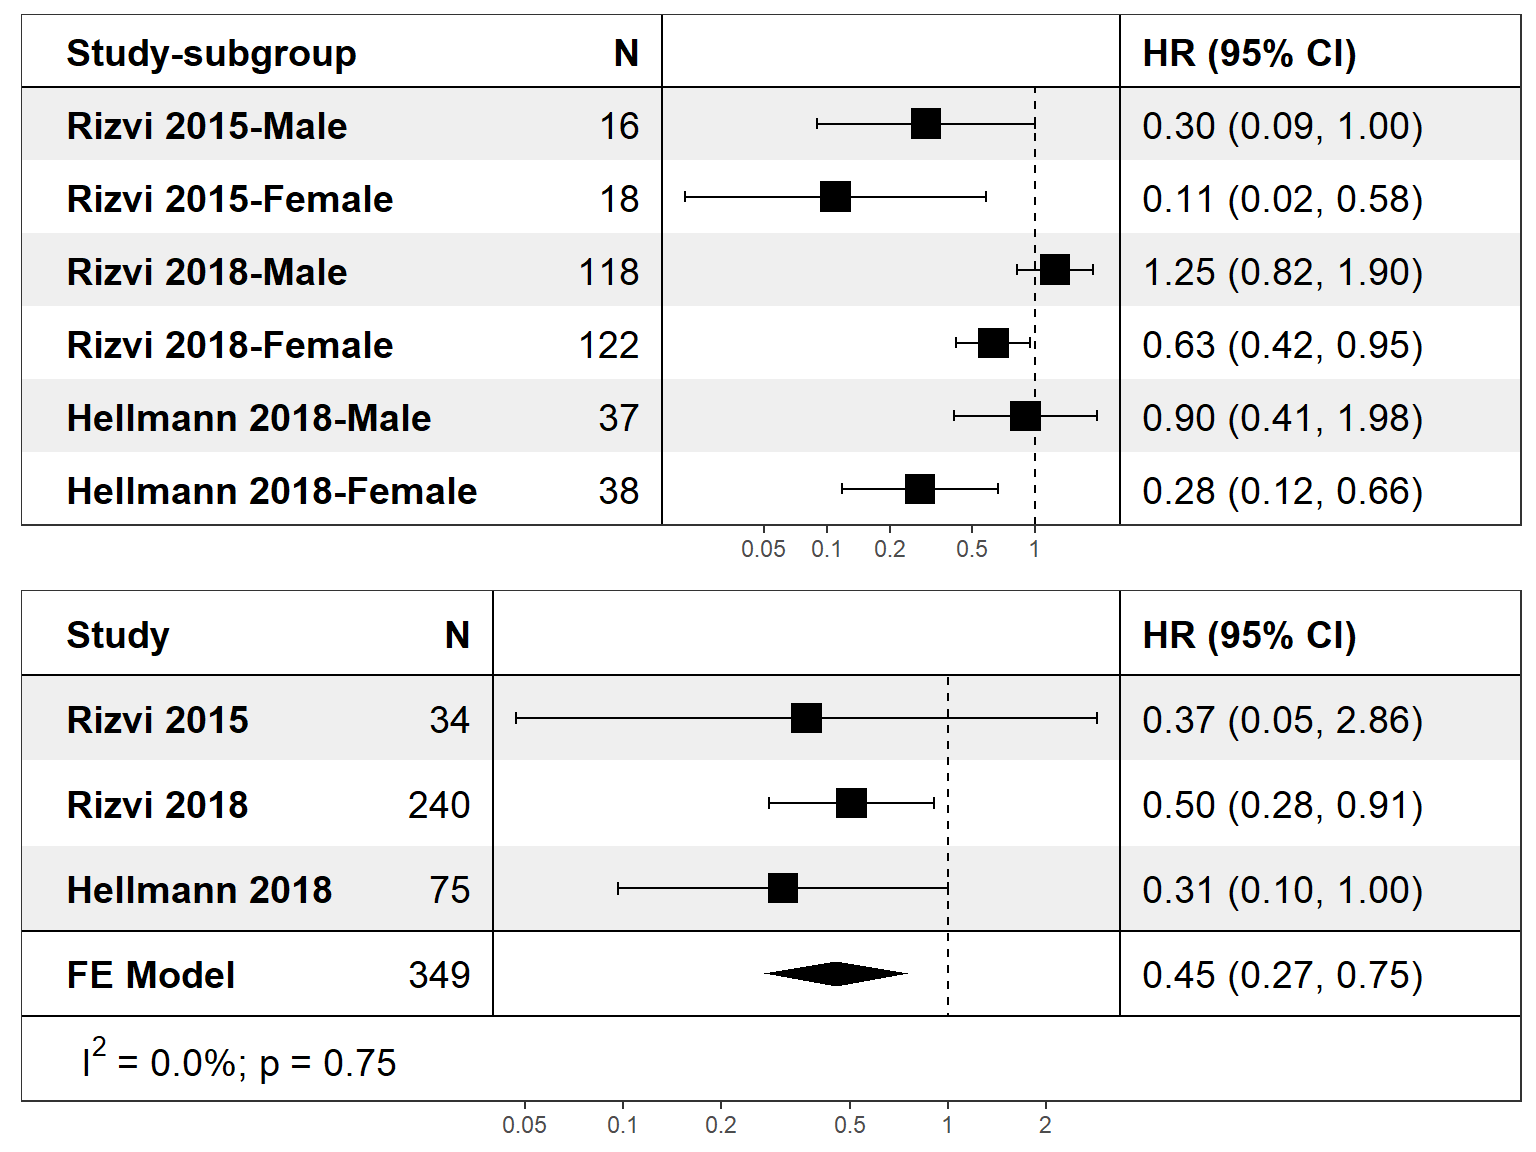
head(data) entry trial subgroup hr ci.lb ci.ub ni conf_q
1 Rizvi 2015-Male Rizvi 2015 Male 0.30 0.09 1.00 16 1.959964
2 Rizvi 2015-Female Rizvi 2015 Female 0.11 0.02 0.56 18 1.959964
3 Rizvi 2018-Male Rizvi 2018 Male 1.25 0.82 1.90 118 1.959964
4 Rizvi 2018-Female Rizvi 2018 Female 0.63 0.42 0.95 122 1.959964
5 Hellmann 2018-Male Hellmann 2018 Male 0.90 0.41 1.99 37 1.959964
6 Hellmann 2018-Female Hellmann 2018 Female 0.28 0.12 0.67 38 1.959964
yi sei
1 -1.2039728 0.6142831
2 -2.2072749 0.8500678
3 0.2231436 0.2143674
4 -0.4620355 0.2082200
5 -0.1053605 0.4030005
6 -1.2729657 0.4387290Visualization
# Meta-Subgroup Analysis
p1 <- deft_show(res, element = "all")
p2 <- deft_show(res, element = "subgroup")
p <- plot_grid(p1, p2, nrow = 2)

p