# Install packages
if (!requireNamespace("shape", quietly = TRUE)) {
  install.packages("shape")
}
if (!requireNamespace("ggplotify", quietly = TRUE)) {
  install.packages("ggplotify")
}

# Load packages
library(shape)
library(ggplotify)Perspective
Note
Hiplot website
This page is the tutorial for source code version of the Hiplot Perspective plugin. You can also use the Hiplot website to achieve no code ploting. For more information please see the following link:
The three-dimensional perspective is a three-dimensional figure that can connect the higher values contained in a matrix with surfaces.
Setup
System Requirements: Cross-platform (Linux/MacOS/Windows)
Programming language: R
Dependent packages:
shape;ggplotify
Data Preparation
The loaded data is a matrix.
# Load data
data <- read.delim("files/Hiplot/137-perspective-data.txt", header = T)

# Convert data structure
data <- as.matrix(data)
col <- drapecol(data)

# View data
head(data)
X100 X101 X102 X103 X104 X105 X105.1 X106 X107 X108 X109 X110 X110.1 X111
[1,] 100 101 102 103 104 105 106 107 108 109 110 110 111 113
[2,] 101 102 103 104 105 105 106 107 108 109 110 111 113 115
[3,] 101 102 103 104 105 106 107 108 109 110 111 113 115 117
[4,] 101 102 103 104 105 106 107 108 109 110 111 112 114 116
[5,] 101 102 103 104 105 106 107 108 109 110 111 111 113 115
[6,] 101 102 103 104 105 106 107 108 109 110 111 113 114 116
X114 X116 X118 X120 X120.1 X121 X122 X122.1 X123 X124 X123.1 X123.2 X120.2
[1,] 115 118 120 121 122 124 125 125 126 127 128 127 124
[2,] 117 118 120 122 125 126 127 128 129 130 131 131 128
[3,] 117 118 121 123 126 128 130 130 131 132 133 134 131
[4,] 117 120 122 124 126 129 130 132 133 135 136 136 134
[5,] 118 121 123 125 127 129 131 133 135 137 138 138 137
[6,] 119 121 124 126 128 130 133 135 137 138 140 140 139
X118.1 X117 X115 X114.1 X115.1 X113 X111.1 X110.2 X109.1 X108.1 X108.2
[1,] 121 120 118 116 114 113 112 112 110 109 109
[2,] 125 121 120 118 116 114 113 113 111 111 111
[3,] 129 125 122 120 118 116 114 113 112 112 113
[4,] 132 129 126 122 120 118 116 114 114 114 114
[5,] 134 132 130 127 122 120 118 116 116 116 116
[6,] 137 135 133 131 127 122 120 118 118 117 117
X107.1 X107.2 X107.3 X108.3 X109.2 X110.3 X111.2 X111.3 X112 X113.1 X113.2
[1,] 108 108 108 109 110 111 112 112 113 114 114
[2,] 111 110 109 110 111 112 113 113 114 115 115
[3,] 112 112 111 112 113 113 114 115 116 116 117
[4,] 114 113 113 114 115 116 116 117 117 117 118
[5,] 115 113 114 115 116 117 117 118 118 119 119
[6,] 116 115 116 116 117 118 118 118 119 119 120
X114.2 X115.2 X115.3 X114.3 X113.3 X112.1 X111.4 X111.5 X112.2 X112.3
[1,] 115 116 116 115 114 113 112 112 113 113
[2,] 116 117 117 116 115 114 114 113 113 114
[3,] 117 118 118 116 116 115 115 115 114 114
[4,] 118 119 119 118 117 116 116 115 115 116
[5,] 119 120 120 119 118 117 117 116 116 117
[6,] 120 121 121 120 119 119 118 117 117 118
X112.4 X113.4 X114.4 X114.5 X115.4 X115.5 X116.1 X116.2 X117.1 X117.2
[1,] 114 114 115 115 116 116 117 117 118 118
[2,] 114 115 115 116 116 117 118 118 119 119
[3,] 115 116 116 117 117 118 118 119 119 120
[4,] 116 116 117 117 118 118 119 120 120 120
[5,] 117 117 118 119 119 119 120 121 121 121
[6,] 119 118 118 118 119 120 122 123 123 123
X116.3 X114.6 X112.5 X109.3 X106.1 X104.1 X102.1 X101.1 X100.1 X100.2 X99
[1,] 117 115 113 111 107 105 103 102 101 101 100
[2,] 118 116 114 112 108 105 103 103 102 101 101
[3,] 120 117 115 112 108 106 104 103 102 102 102
[4,] 120 119 116 113 109 106 104 104 103 102 102
[5,] 121 119 116 113 110 107 105 105 103 103 103
[6,] 122 120 117 113 110 108 106 105 104 103 103
X99.1 X99.2 X99.3 X98 X98.1 X97 X97.1
[1,] 100 100 99 99 98 98 97
[2,] 100 100 99 99 98 98 97
[3,] 101 100 99 99 99 98 98
[4,] 101 101 100 99 99 99 98
[5,] 102 101 100 100 99 99 99
[6,] 102 101 101 100 100 99 99Visualization
# Perspective
p <- as.ggplot(function() {
  persp(as.matrix(data),
    theta = 45, phi = 20,
    expand = 0.5,
    r = 180, col = col,
    ltheta = 120,
    shade = 0.5,
    ticktype = "detailed",
    xlab = "X", ylab = "Y", zlab = "Z",
    border = "black" # could be NA
  )
  title("Perspective Plot", line = 0)
})

p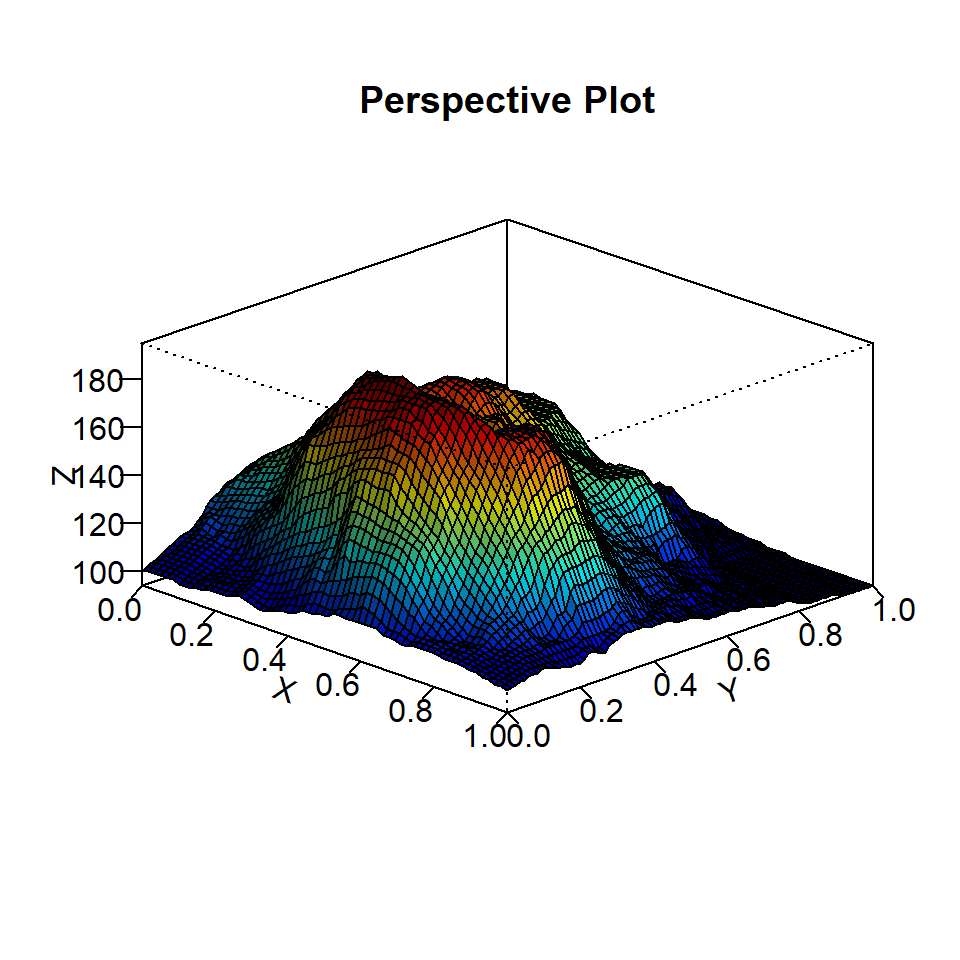
A clear view of a mountain peak.