# Install packages
if (!requireNamespace("treeheatr", quietly = TRUE)) {
  install.packages("treeheatr")
}
if (!requireNamespace("ggplotify", quietly = TRUE)) {
  install.packages("ggplotify")
}

# Load packages
library(treeheatr)
library(ggplotify)Treeheatr
Note
Hiplot website
This page is the tutorial for source code version of the Hiplot Treeheatr plugin. You can also use the Hiplot website to achieve no code ploting. For more information please see the following link:
The heatmap decision tree is a visualization graph that combines two types of graphs: heatmap and decision tree visualization.
Setup
System Requirements: Cross-platform (Linux/MacOS/Windows)
Programming language: R
Dependent packages:
treeheatr;ggplotify
Data Preparation
The first column is the name of the species, the second column is the island, and the rest are the species characteristics.
# Load data
data <- read.delim("files/Hiplot/172-treeheatr-data.txt", header = T)

# convert data structure
x <- data
wrong_cols <- suppressWarnings(sapply(x, function(x) {
  if (!is.numeric(x)) {
    sum(!is.na(as.numeric(x))) > 0.7 * length(x)
  } else {
    FALSE
  }
}))
if (any(wrong_cols)) {
  ix <- which(wrong_cols)
  for (i in ix) {
    data[[i]] <- suppressWarnings(as.numeric(data[[i]]))
  }
  rm(ix)
}
rm(x, wrong_cols)

# View data
head(data)
species island culmen_length_mm culmen_depth_mm flipper_length_mm
1 Adelie Torgersen 39.1 18.7 181
2 Adelie Torgersen 39.5 17.4 186
3 Adelie Torgersen 40.3 18.0 195
4 Adelie Torgersen NA NA NA
5 Adelie Torgersen 36.7 19.3 193
6 Adelie Torgersen 39.3 20.6 190
body_mass_g sex
1 3750 MALE
2 3800 FEMALE
3 3250 FEMALE
4 NA <NA>
5 3450 FEMALE
6 3650 MALEVisualization
# Treeheatr
p <- as.ggplot(function() {
  print(heat_tree(data,
    target_lab = "species",
    task = 'classification',
    show = "heat-tree",
    heat_rel_height = 0.2,
    panel_space = 0.001,
    clust_samps = T,
    clust_target = T,
    lev_fac = 1.3,
    cont_legend = F,
    cate_legend = F
  ))
})

p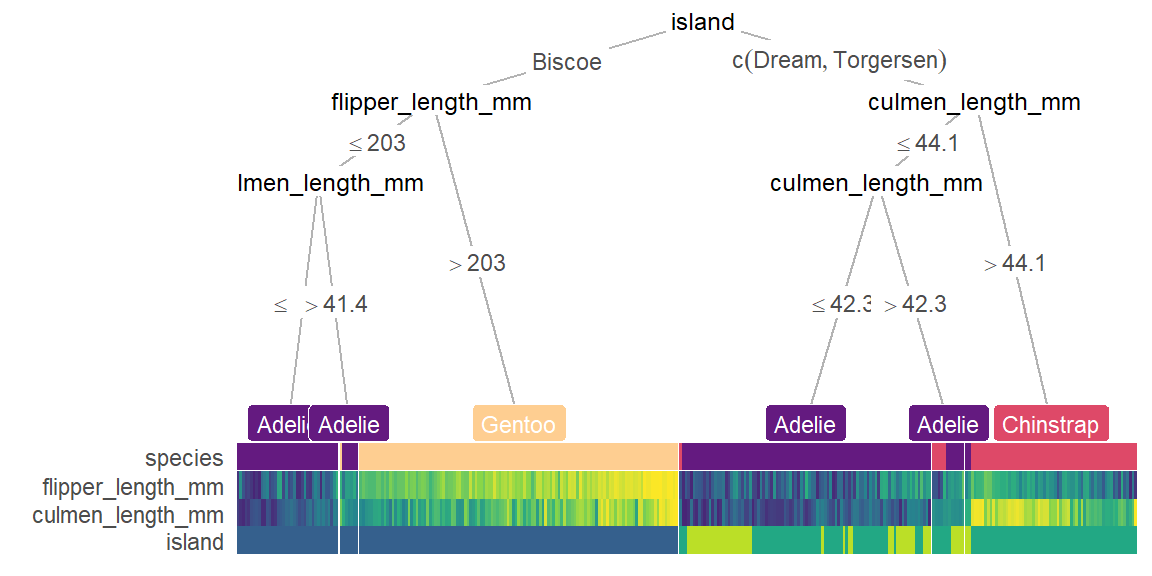
The upper half of the figure is a decision diagram, and the lower half is a heat map.
Decision tree: The topmost island has the greatest influence on the classification of species, and can be classified into different species according to different conditions.
Heatmap: you can observe the changes in the amount of each species under each condition.
Legend: For each categorical variable, different colors indicate different types; for continuous variables, the higher the value, the lighter the color, otherwise, the darker.