# Install packages
if (!requireNamespace("grafify", quietly = TRUE)) {
  install.packages("grafify")
}
if (!requireNamespace("dplyr", quietly = TRUE)) {
  install.packages("dplyr")
}

# Load packages
library(grafify)
library(dplyr)Point (SD)
Note
Hiplot website
This page is the tutorial for source code version of the Hiplot Point (SD) plugin. You can also use the Hiplot website to achieve no code ploting. For more information please see the following link:
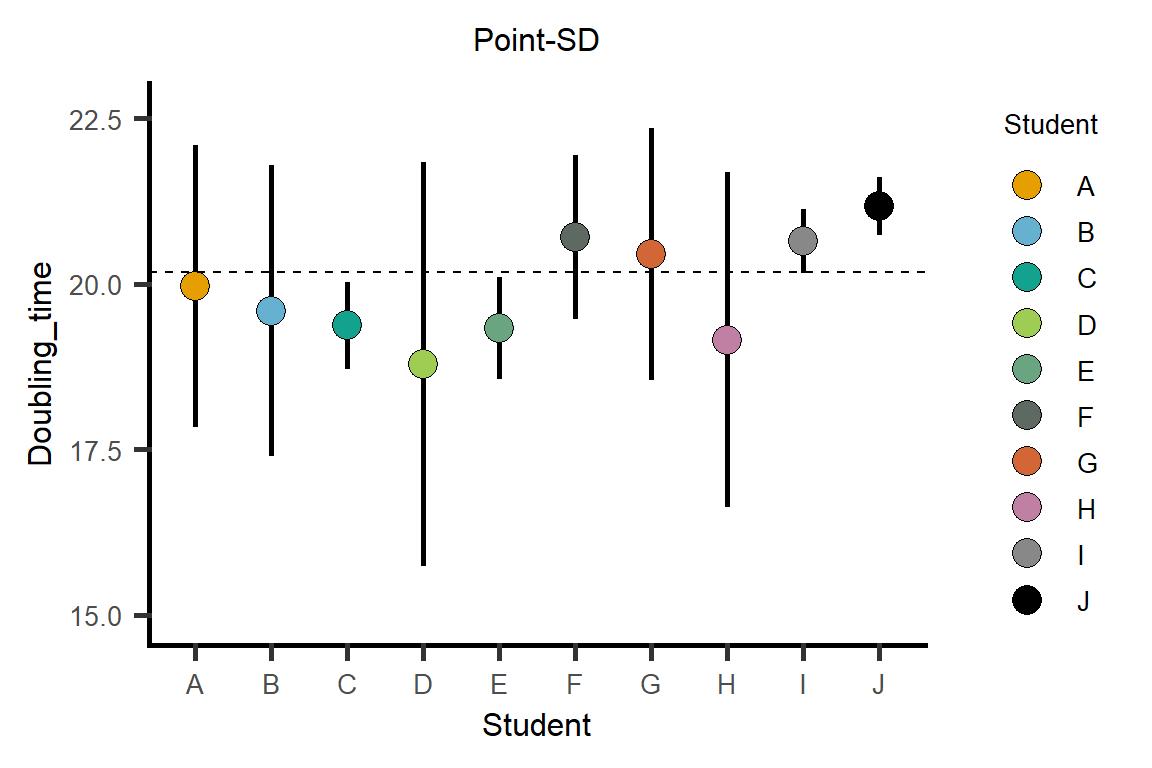
Displaying the standard deviation (SD) of multi-group data.
Setup
System Requirements: Cross-platform (Linux/MacOS/Windows)
Programming language: R
Dependent packages:
grafify;dplyr
Data Preparation
# Load data
data <- read.delim("files/Hiplot/142-point-sd-data.txt", header = T)

# Convert data structure
y <- "Doubling_time"
group <- "Student"
data[, group] <- factor(data[, group], levels = unique(data[, group]))
data <- data %>%
  mutate(median = median(get(y), na.rm = TRUE),
         mean = mean(get(y), na.rm = TRUE))

# View data
head(data)
Experiment Student Doubling_time facet median mean
1 Exp1 A 17.36765 F1 20.18114 19.91642
2 Exp1 B 18.04119 F1 20.18114 19.91642
3 Exp1 C 18.70120 F1 20.18114 19.91642
4 Exp1 D 20.06762 F1 20.18114 19.91642
5 Exp1 E 20.19807 F2 20.18114 19.91642
6 Exp1 F 22.11908 F2 20.18114 19.91642Visualization
# Point (SD)
p <- plot_point_sd(data = data, Student, Doubling_time, symsize = 5,
                   symthick = 0.5, s_alpha = 1, ewid = 0, symshape = 21,
                   all_alpha = 0) +
  geom_hline(aes(yintercept = median), colour = 'black', linetype = 2,
             size = 0.5) +
  xlab(group) + ylab(y) +
  guides(fill = guide_legend(title = group)) +
  ggtitle("Point-SD") +
  theme(text = element_text(family = "Arial"),
        plot.title = element_text(size = 12,hjust = 0.5),
        axis.title = element_text(size = 12),
        axis.text = element_text(size = 10),
        axis.text.x = element_text(angle = 0, hjust = 0.5,vjust = 1),
        legend.position = "right",
        legend.direction = "vertical",
        legend.title = element_text(size = 10),
        legend.text = element_text(size = 10))


p